Installing ELK Stack to collect journald logs
As I mentioned on my previous post, I’ve been spending much time lately looking for errors and information on my Raspberry Pi’s logs. Not that it bothers me! - a considerable part of my work consists of reading logs, after all. I was only wondering if there was a way to collect the logs in a way that makes them easier to navigate, filter out for relevant info, and so on.
I already had contact with Prometheus and Grafana and knew about the existence of Loki - which basically collects your logs in the same way as Node Exporter collects metrics for Prometheus. But for this experiment I wanted to give a try to the ELK-stack (Elasticsearch, Logstash and Kibana). During the final project for my vocational training, I discarded the ELK stack precisely because I wasn’t interested on collecting log information. This time it’s the other way around and I’m looking forward to see if it meets my expectatives and as always, to learn something new along the way!
Disclaimer & Credits
I used the Official documentation from Elastic, as well as a fantastic guide from Digital Ocean, written by Erin Glass and Jamon Camisso: How To Install Elasticsearch, Logstash, and Kibana (Elastic Stack) on Ubuntu 22.04 My main focus was to collect journald’s logs - you can collect many other system logs! Refer to the Digital Ocean guide for other examples and explanations on different Beat types.
Installation
Elasticsearch
The official website has loads of documentation and alternative ways to get the stack up and running. They also provide a script to run the whole stack as a container. For my case I’ll stick to apt (I wrote down the instructions for deb-package in case I need to start again from scratch).
Using APT
- Copy Elasticsearch’s PGP Key:
wget -qO - https://artifacts.elastic.co/GPG-KEY-elasticsearch | sudo gpg --dearmor -o /usr/share/keyrings/elasticsearch-keyring.gpg - Add their repositories with:
echo "deb [signed-by=/usr/share/keyrings/elasticsearch-keyring.gpg] https://artifacts.elastic.co/packages/8.x/apt stable main" | sudo tee /etc/apt/sources.list.d/elastic-8.x.list - Update your package manager and install Elasticsearch:
sudo apt update && sudo apt install elasticsearch
This will install the latest available version for Elasticsearch. Alternatively, it is possible to download the deb-package from their website.
Using deb-package
- Check your CPU architecture with
uname -a. - Check the official download site to get the link for your architecture, and download the package:
sudo wget https://artifacts.elastic.co/downloads/elasticsearch/elasticsearch-8.17.0-arm64.deb - Install the package:
sudo dpkg -i elasticsearch-8.17.0-arm64.deb
During installation, a password for a super-user will be automatically generated, don’t forget to save it!
After download, you can enable and start the service with systemd:
1
2
3
sudo systemctl daemon-reload
sudo systemctl enable elasticsearch
sudo systemctl start elasticsearch
And also test if the service is running correctly - Elasticsearch runs on port 9200, so we can send a HTTP request using the certificate that has been automatically generated during installation. For the following command to work, you might want to save your superuser password as a Shell variable with export $ELASTIC_PASSWORD="your_pw":
1
sudo curl --cacert /etc/elasticsearch/certs/http_ca.crt -u elastic:$ELASTIC_PASSWORD https://localhost:9200
Logstash and Kibana
- If you downloaded Elasticsearch using the APT-method, you already have access to Elastic’s repositories and can download Logstash and Kibana by simply running an
sudo apt install. If you downloaded the deb-packages for Elasticsearch, you can do exactly the same for Logstash and Kibana - here you can find download links for each package according to your CPU architecture: Logstash, Kibana. - Same as before, reload systemd daemons, enable and start the services we just installed.
Getting Started
First we need to properly configure Kibana and connect it to our Elasticsearch instance.
- Check Kibana’s configuration file on
/etc/kibana/kibana.ymland change according to your needs - you might want to use an alternative port number or another binding address. Remember to reload Kibana if you change anything on this file. - Connect Kibana to Elasticsearch by generating an enrollment token:
sudo /usr/share/elasticsearch/bin/elasticsearch-create-enrollment-token -s kibana. Open Kibana on your browser and paste the token - it will ask for a verification code that you can generate usingsudo /usr/share/kibana/bin/kibana-verification-code. - Check your instance status opening
http://<ip>/5061:status
Now we need to start feeding the logs to our ELK-instance, for this purpose we’ll use Filebeat.
- Prepare Logstash to work with Filebeat - for this, we will need an input and an output file. On the input file, we will tell Logstash where to get the log files from (Filebeat, which will be running on port 5044). On the output, we indicate that the data should be sent to our Elasticsearch instance (listening on port 9200).
- Create an input file (
/etc/logstash/conf.d/02-beats-input.conf) and paste the following:
1
2
3
4
5
input {
  beats {
    port => 5044
  }
}
- Do the same for the output file (
/etc/logstash/conf.d/30-elasticsearch-output.conf), with the following content:
1
2
3
4
5
6
7
8
9
10
11
12
13
14
15
16
output {
  if [@metadata][pipeline] {
	elasticsearch {
  	hosts => ["localhost:9200"]
  	manage_template => false
  	index => "%{[@metadata][beat]}-%{[@metadata][version]}-%{+YYYY.MM.dd}"
  	pipeline => "%{[@metadata][pipeline]}"
	}
  } else {
	elasticsearch {
  	hosts => ["localhost:9200"]
  	manage_template => false
  	index => "%{[@metadata][beat]}-%{[@metadata][version]}-%{+YYYY.MM.dd}"
	}
  }
}
- Test the configuration files with
sudo -u logstash /usr/share/logstash/bin/logstash --path.settings /etc/logstash -t - Now install Filebeat - same as before, either using apt or downloading and installing the deb-package from the official site.
- Set up the configuration file
/etc/filebeat/filebeat.ymlso that we will be using Logstash as output for now - comment out the lines for Elasticsearch and save the file. - Configure the inputs that we want to feed to Filebeat - for this, scroll through the configuration file
/etc/filebeat/filebeat.ymland configure an input for journald by adding the following lines:
1
2
3
filebeat.inputs:
- type: journald
  id: everything
You can fine-tune this input by adding regexp and filters. Refer to the official documentation about journald input for more information.
- Start up feeding the information pipelines with
sudo filebeat setup --pipelines - Return fo Filebeat’s configuration file and revert the changes we previously did - now we want to comment out Logstash as output and use Elasticsearch instead. Save the file and run the following commands to start indexing the information for Elasticsearch, and then feed it to Kibana to set up dashboards accordingly:
sudo filebeat setup --index-management -E output.logstash.enabled=false -E 'output.elasticsearch.hosts=["localhost:9200"]',sudo filebeat setup -E output.logstash.enabled=false -E output.elasticsearch.hosts=['localhost:9200'] -E setup.kibana.host=localhost:5601
Remember that the access to Elasticsearch is password-protected and uses a certificate. You might want to generate a key to use it on the configuration file, so that the connection to Elasticsearch doesn’t fail. Also, be sure to pass the certificate path so that it doesn’t get rated as unstrusted while we’re setting up this connection.
- The last commands will take a little while. Once everything is correctly set up, we can -again- reload systemd daemons, enable and start our new Filebeat service.
Final impressions
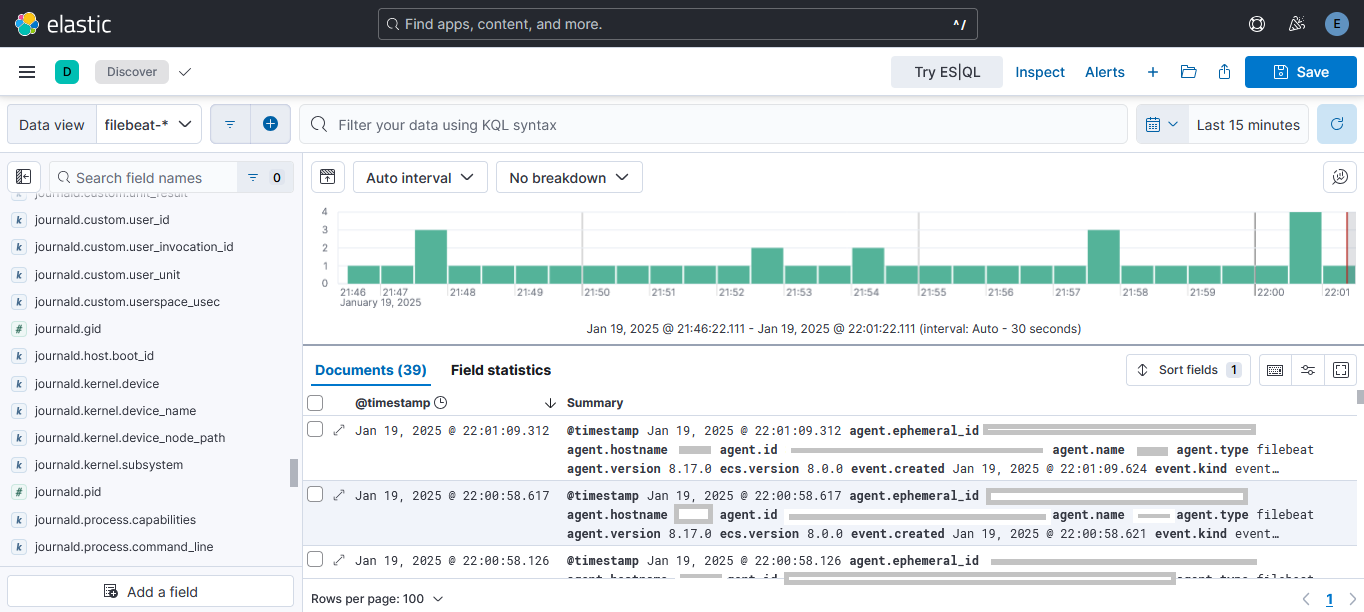
That’s it! Navigate to your Kibana instance and go to Discover - from there you can select the filebeat-* filter and start exploring the information collected. There are also many Dashboards perfectly tailored for different Filebeat modules, but I didn’t find any so far for journald logs.
To be honest I still don’t know how can I can retrieve the information that I’m interested in - I guess I’ll have to fine-tune the input configuration of Filebeat to filter out the services I want. Or even use the Journald-Agent that’s already offered by Elastic. I’ll test it out for a couple of weeks and will decide if this really suits my needs.