Fun with Monitoring (I)
Introduction
The final project for my vocational training consisted on gathering custom metrics from various SAP-systems and exposing those to a Prometheus server. Ultimately, the recorded metrics were gathered on a Grafana dashboard, which provided with an accurate portrait of the current state of a whole SAP landscape.
I tweaked Node Exporter a little bit, so that it would provide me exclusively with the metrics I wanted to collect. These were gathered using Bash scripts, and the whole toolbox (Bash scripts + Node Exporter) was nicely provisioned using Ansible.
Maybe one day I’ll be so proficient that I can write my own Node Exporter with Go, but until then I’d like to adapt this tiny project I liked so much. My goal is investigating other use cases and scenarios, and as always, learn something new along the way.
As I’ll be testing different scenarios and scopes, I decided to write short posts which will be a part of a series.
1st Milestone: Deploying Prometheus, Node Exporter & Grafana on my lab
Let’s get started with something simple and straightforward - installing Prometheus and Grafana on my lab, and Node Exporter on those hosts I would like to keep an eye on. Those comprise:
- A PC running Linux
- A Raspberry Pi
- Two containers running on the Pi
The first two will get an out-of-the-box Node Exporter, as I’m only interested in collecting metrics concerning hardware and some basic software performance. For the containers, I’d get a container specific one which should give me insights about its usage and performance (a more application-oriented view).
On later projects, I’d like to start monitoring my router as well.
Installing and Configuring Prometheus & Node Exporter
As my lab is currently somewhat limited, both Prometheus and Grafana will be installed on the Pi. I’ll install these as applications instead of containers.
For this I simply ran a sudo apt install prometheus. For my project I had to install Prometheus from source - there is plenty of documentation out there to get this done, such as this tutorial from DevOpsCube. I’ll install Grafana later on.
Node Exporter was pre-installed with that command, so I only had to run sudo apt install prometheus-node-exporter on the other host I wanted to started monitoring.
I checked the status of Prometheus with systemctl status prometheus and everything was running perfectly (the package installation spares you configuring the systemd file, enabling and starting the service). The web UI of Prometheus was also accessible via http://<IP-of-host>:9090/, exactly as it should:
Same goes for Node Exporter on the monitored host - the metrics were being exposed on http://<IP-of-host>:9091/. I only had to connect this second host to the monitoring server by opening Prometheus’ config and appending the following:
1
2
3
4
5

- job_name: name-of-your-host
    static_configs:
      - targets: ['<IP-or-FQDN>:9100']
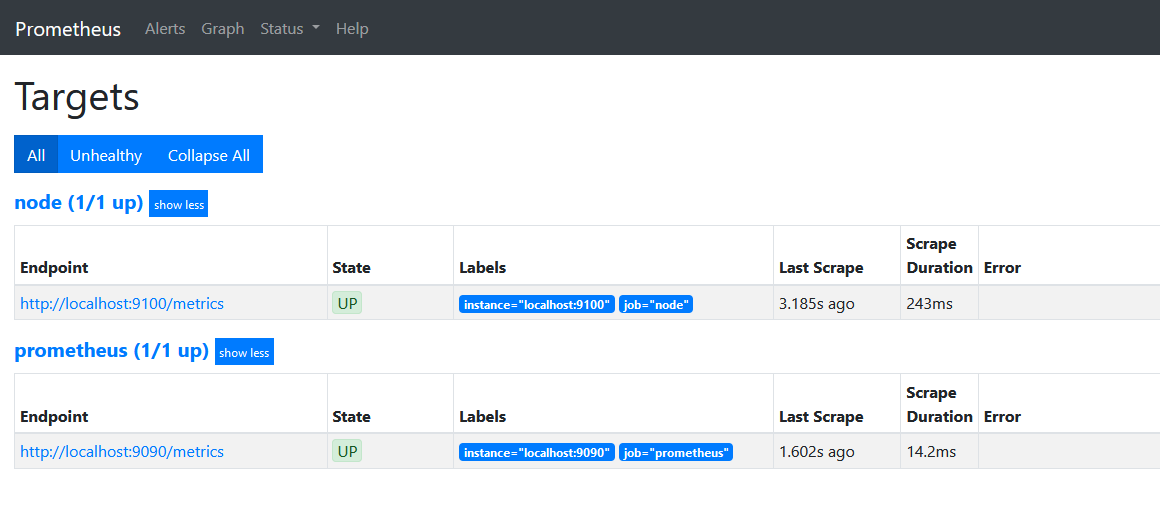
After restarting Prometheus (systemctl restart prometheus), the web interface will start showing the metrics of this newly added host. The next step would be installing the exporter on the containers and connecting them to Prometheus.
Installing and Configuring cAdvisor with Docker Compose
cAdvisor is an ad-hoc exporter for containers. The Prometheus’ Docs include a tutorial to set it up on a multi-container environment.
For my containers, I decided to download the image and provision it using docker-compose, as I did with my other containerized services. To accomplish this, I followed these steps:
- Download the cAdvisor image:
sudo docker pull google/cadvisor:latest(you might want to usezcube/cadvisorinstead if you plan to run cAdvisor on an ARM architecture) - Create a docker-compose file and paste the following lines:
1
2
3
4
5
6
7
8
9
10
11
12
13
14
15
16

cadvisor:
    container_name: cadvisor
    image: zcube/cadvisor:latest
    ports:
    - 9092:8080 # By default cAdvisor runs on port 8080, but Nextcloud was already using this port so I had to choose another one.
    volumes:
    - /:/rootfs:ro
    - /var/run:/var/run:rw
    - /sys:/sys:ro
    - /var/lib/docker/:/var/lib/docker:ro
    - /etc/machine-id:/etc/machine-id:ro
    - /var/lib/dbus/machine-id:/var/lib/dbus/machine-id:ro
    devices:
    - /dev/kmsg:/dev/kmsg
- Take up the container with
sudo docker-compose up. You can take a look at the collected metrics onhttp://<IP-or-hostname>:9092/containers
Originally I added the lines to my Nextcloud’s docker-compose file. To my surprise, cAdvisor started gathering metrics about other containers. I supposed this was related to the network configuration, as all containers were on the same Docker network. To test this, I simply ran cAdvisor using a separate (dedicated) docker-compose file - the result remained the same. If you still want to attach cAdvisor to the docker-compose file of another service, simply refer to the Guide on Prometheus’ Docs and adjust accordingly to your use case.
- Lastly, we need to add cAdvisor’s “contact information” into our Prometheus’ config. As we did before, we append the following lines to
/etc/prometheus/prometheus.yml:
1
2
3
4
5

- job_name: cadvisor
    static_configs:
      - targets: ['<IP-or-FQDN>:9092']
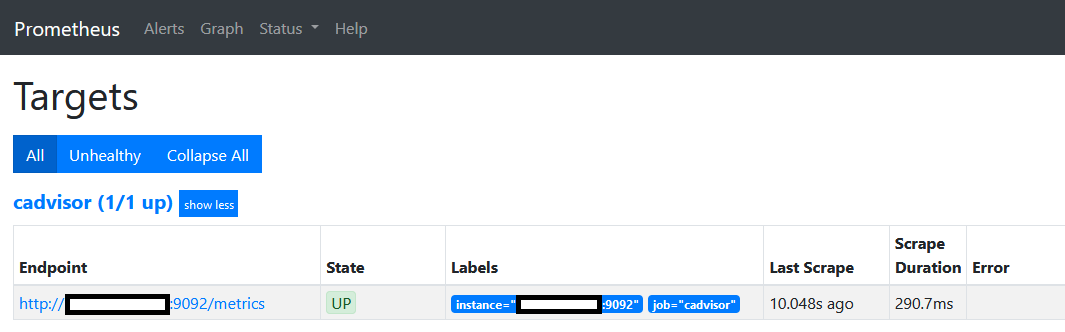
- After restarting Prometheus, it will start gathering the metrics provided by cAdvisor:
Installing and Setting Up Grafana
Unlike Prometheus and Node Exporter, apt won’t find any good install candidate for Grafana, so I headed to the Official Docs and followed all the steps described there - before installing Grafana, you need to add its repository. All steps are explained in the docs.
After installation, enable and start the service with systemctl enable grafana-server and systemctl start grafana-server.
To get started, open http://<IP-or-hostname>:3000/ and change the default password.
Setting up the Data Source
Grafana works like a charm with Prometheus, so that the Data Source configuration will be super easy.
- Open Grafana Web UI
- Go to Home > Connections > Data Sources and click Add Data Source
- Prometheus should be the first data source suggestion on the list
- Type in the requested information (we will be leaving the URL as it is, since in this example both Prometheus and Grafana coexist on the same host)
- Save and Test
Setting up Dashboards
After installation and config, I decided to import a simple Node Exporter Full Dashboard. It comes with all useful metrics and visualizations you can think of, so that tweaking will be easier for later posts.
Simply download the latest .json and import it to the Grafana Web by clicking on Home > Dashboards > New > Import
You can either drag’n’drop the file or copy-paste its contents. Select the appropriate data source for this Dashboard (this is the Prometheus data source we just configured) and click on Import.
Voilà! In matter of seconds we have a super-detailed dashboard containing all metrics from the hosts we previously configured. We won’t see there the metrics from cAdvisor, for this we will create a separate Dashboard repeating exactly the same steps, but uploading the cAdvisor Exporter Dashboard file instead.
Now that our dashboards are up and running, in upcoming posts we will delve into topics such as hardening and customization.